How to Create an Interactive Map: Custom Design vs. Base Map
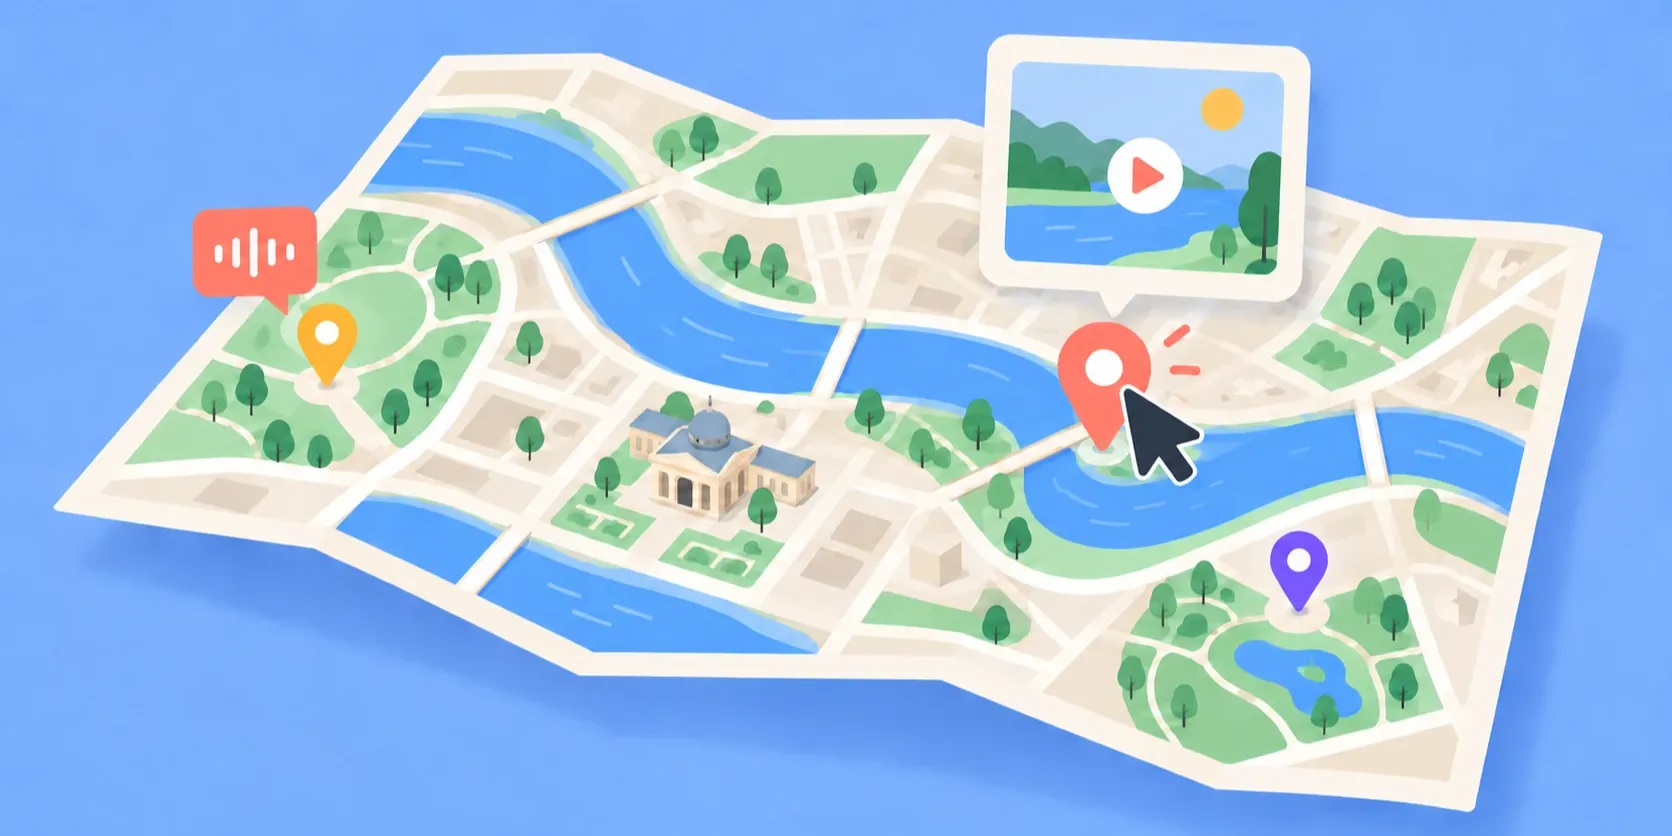
Some stories are best told through a map. An interactive map is a map the reader acts on. They zoom, pan, and tap a point to open text, an image, a video, or a sound, and choose what to display. The background can be a geographic map (Google Maps, OpenStreetMap, Mapbox) or any image: the plan of a zoo, a trade show, or an imaginary city.
There are two ways to create an interactive map. With a base map, you start from an existing geographic map and place your points by their coordinates. It’s the right approach for real places, but customization is more limited. With a custom map, you draw the background yourself: the layout, the style, and the places, real or imagined, are entirely yours.
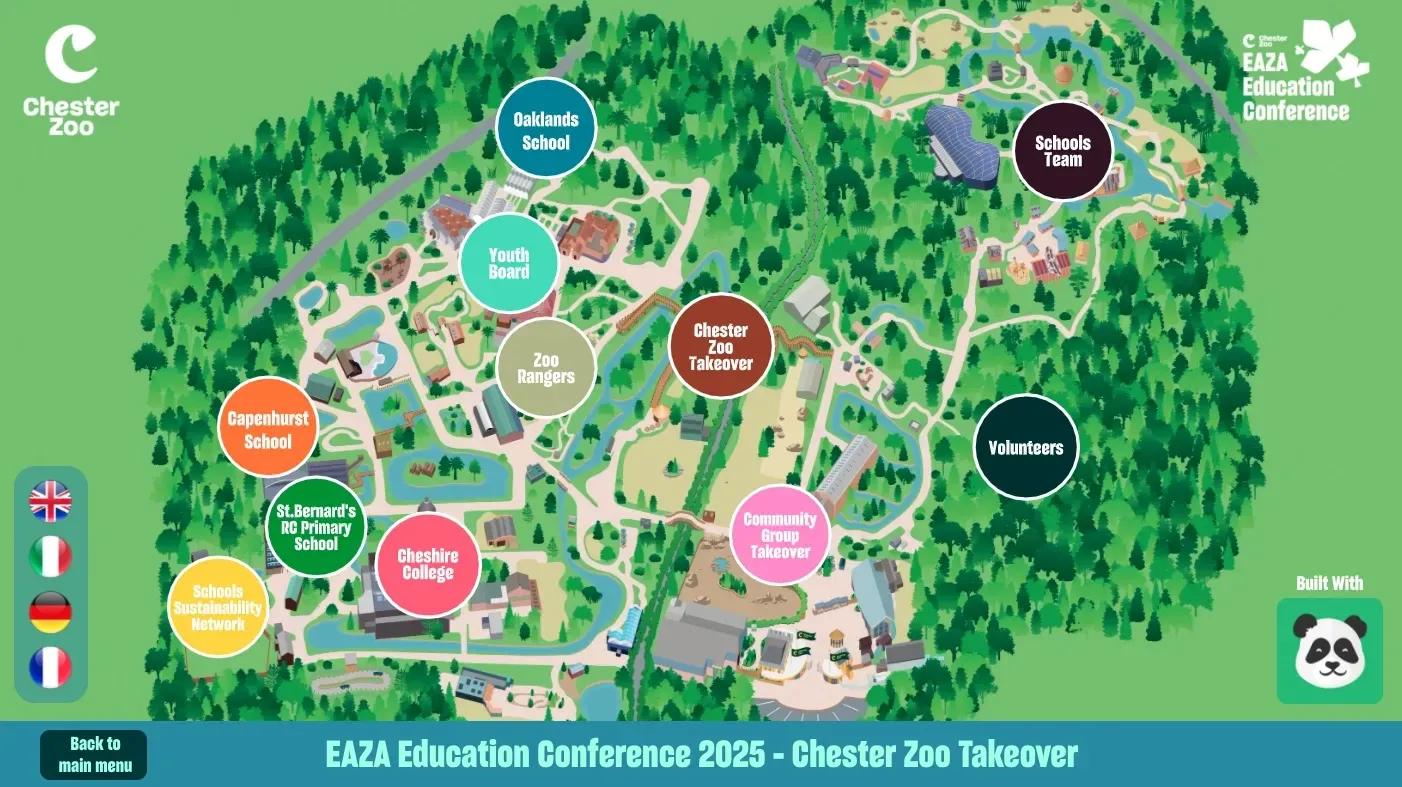
For the Paris 2024 Olympics, the organizers published an interactive map of traffic restrictions, built on a base map. Chester Zoo drew its own on an illustrated plan of the zoo for a European conference. Attendees could open it online or on a kiosk at the zoo.
Base-Map Tools and Their Limits
Traditional tools all start from a geographic map of the real world: you style it, then place your points on it.
- Google My Maps drops pins and draws areas on Google Maps, and shares the result with a link. For a map of your stores or an event, it’s often enough.
- Mapbox is a well-known map provider. It takes style customization a long way: colors, fonts, roads, buildings, data layers.
- OpenStreetMap is a free, open map of the world, built by volunteer contributors.
These tools share one limit, and it comes with what they are: the background is always the real territory. You can change its colors, not draw it. A trade show booth, a museum gallery, a cutaway of an industrial site, or an imaginary city has no place there. None of them has an address or coordinates.
And a map is often just one part of a project. My Maps accepts photos and videos, and embeds in a website without code. But what if the map needs to lead to other screens, follow a route, or run on a kiosk? Then these tools have to be built into a website or an app, usually by a developer.
For real places, though, they’re still the right answer, and PandaSuite uses them too (see below).
Create Your Own Map from an Image
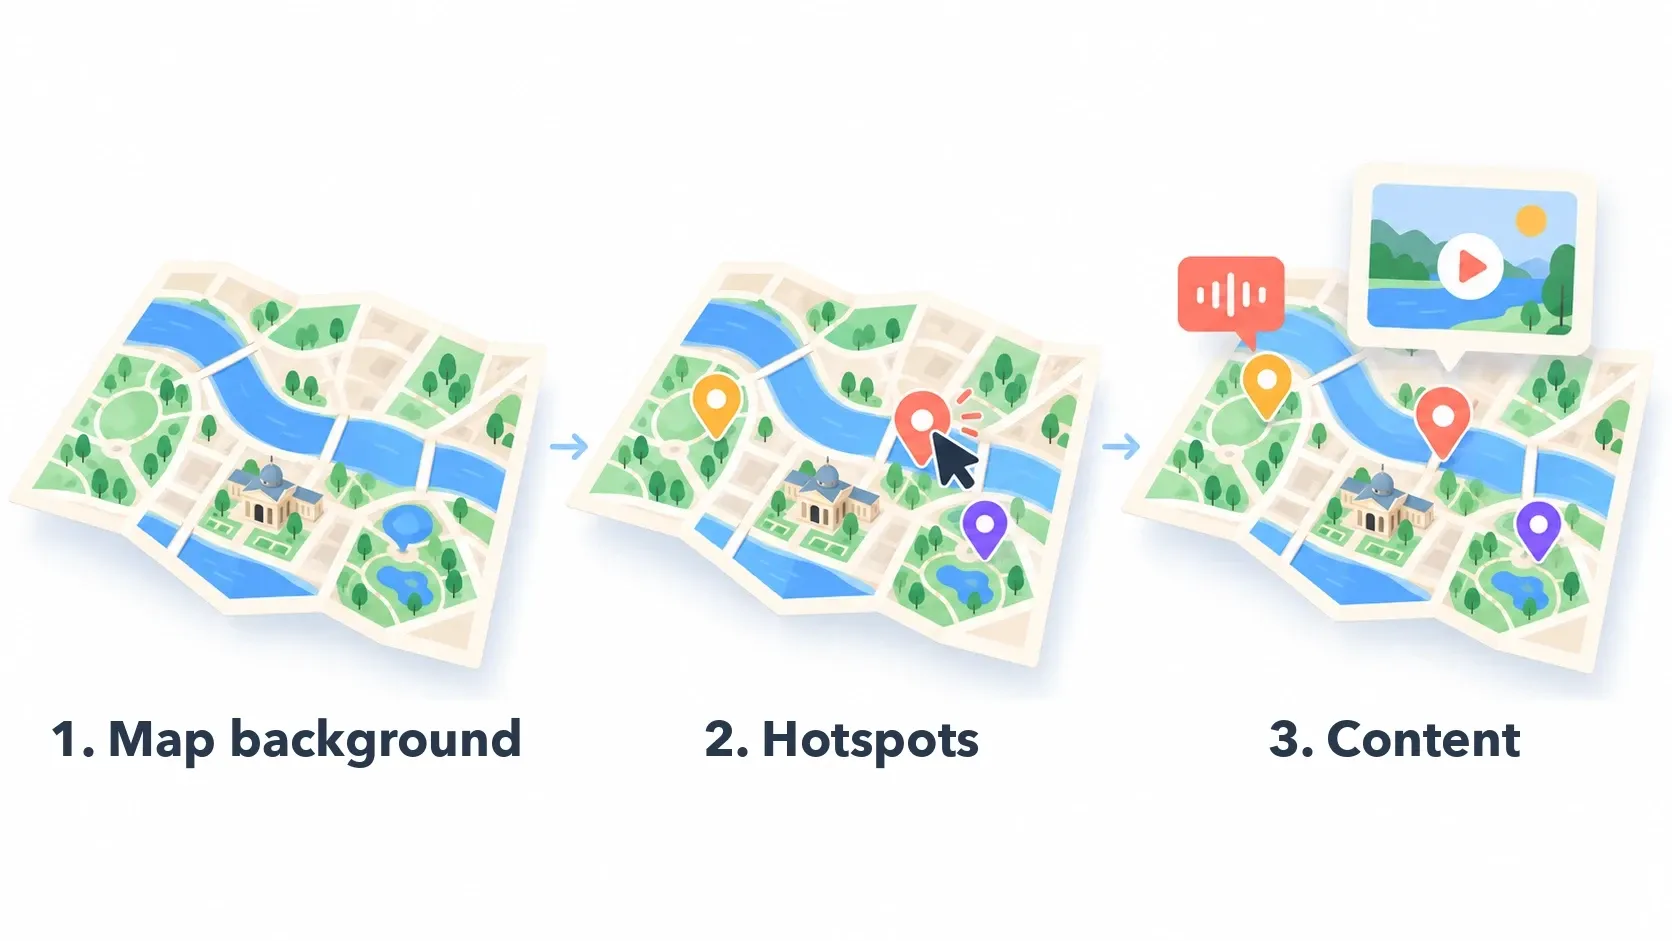
A custom map starts with an image: an illustration, an architect’s floor plan, a diagram, an SVG imported from Illustrator. In PandaSuite, three steps turn it into an interactive plan.
- Make the image explorable: with the Zoomable component, readers zoom and pan across your image, just like a map.
- Add clickable points: on the image, you place hotspots that open pop-ups or popovers (text, a photo, a video, a sound).
- Animate the journey: states create zoom effects and animations from one area to the next.
On an image, points aren’t geolocated: they sit on the drawing, not on GPS coordinates. For a zoo plan, that’s exactly what you want; for a map of your branch offices, a base map will do better.
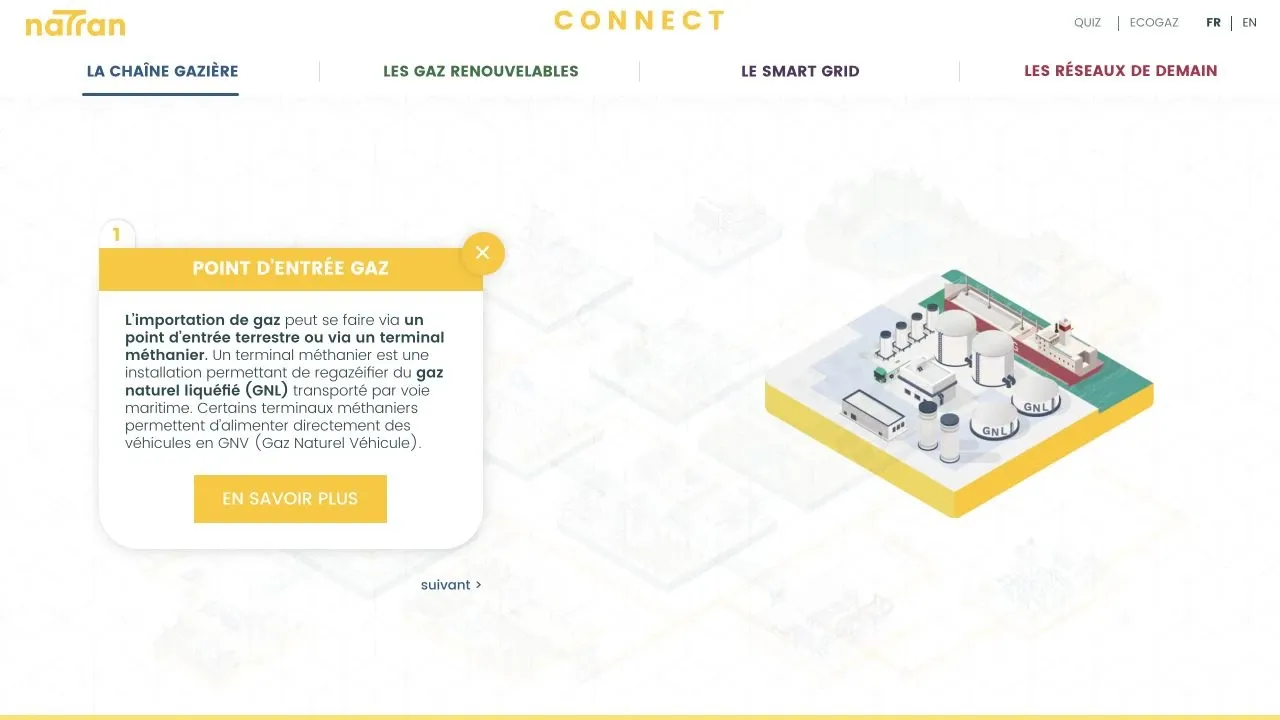
NaTran (formerly GRTgaz), a major player in gas transport in France, explains its network this way in its Connect platform, built with the agency Virtuoz. The background is an illustrated plan, and every label on the map is a clickable point:
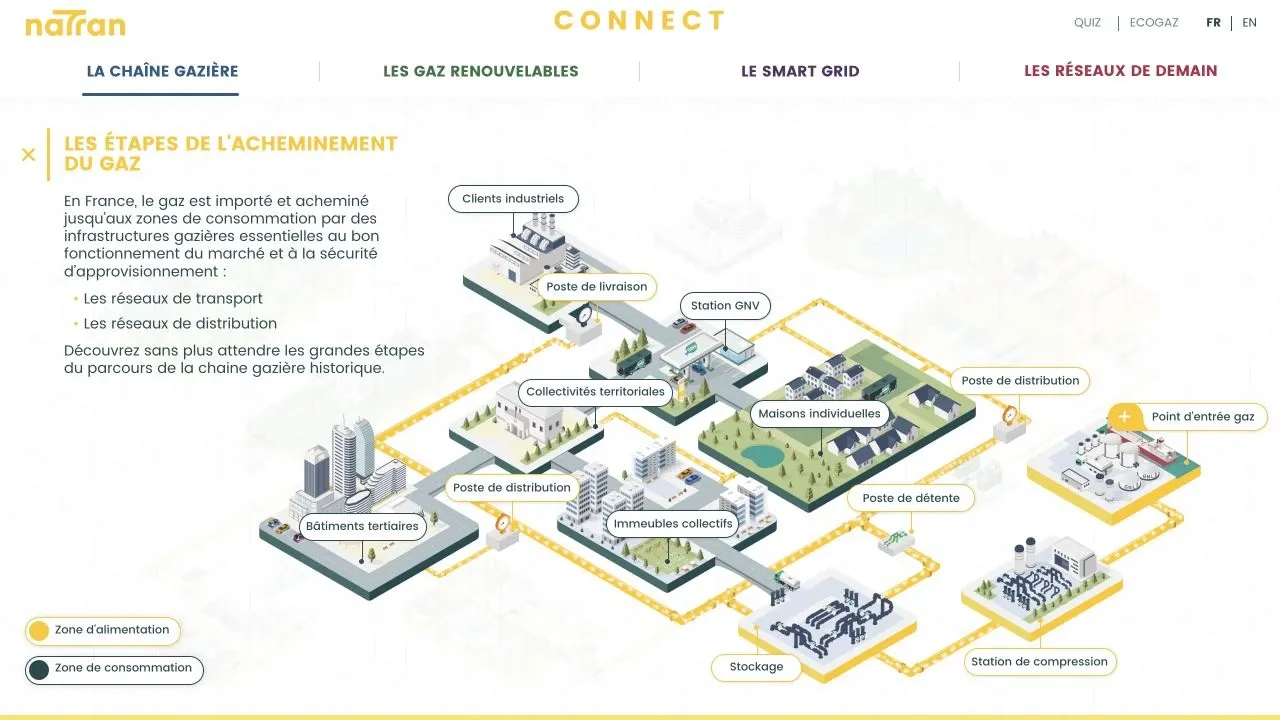
One click opens the page for that step, with its text and a link to learn more:
Chester Zoo did the same with an illustrated plan of the zoo, to present its areas and education projects in four languages. Published as a web app, the map also runs on a kiosk at the zoo and is updated remotely.
And during a hackathon with Flammarion, the Atlas of Rome, published by Autrement, was turned into multimedia interactive maps:
Playing this video loads the YouTube player (Google Ireland Ltd), which stores data on your device to run the player and measure viewing, as described in Google's privacy policy. You can also watch it on YouTube .
The same approach works on a real map. The Map component displays Google Maps, OpenStreetMap, or Mapbox, with points of interest, areas, and routes. Markers can come from a data source, as in the Paris City Guide template powered by Airtable. Google Maps requires an API key. Mapbox requires an account, free up to 50,000 map loads a month, then pay-as-you-go.
With GPS and geofencing, content can even be triggered when visitors enter an area: that’s how the Interactive Sound Walk template works.
Steps to Create an Interactive Map
An interactive map is made of three elements: the map background, points of interest (or hotspots), and additional content (text, images, video, etc.).
- Define the Objective: Start with the goal of your interactive map. What do you want to show or tell? The answer guides your choice of data, tool, and structure.
- Select the Data: Choose what your map will display: locations, points of interest, routes, geographic areas. Then decide whether you’ll add them to the map by hand or pull them from a data source.
- Customize the Appearance: Design your map’s style, colors, icons, and fonts to match your brand or your project’s needs.
- Add Interactions: Set up actions, such as clicking a point to display more information.
- Test and Publish: Before publishing, test your map on different devices to make sure it works everywhere. Then publish it on your website, share it with a link, or export it as an app.
Where to Start
It all starts with the background. If your places are real and a geographic map’s look works for you, a map provider may be enough. PandaSuite takes over when the map needs to fit into a larger experience. For a plan in your own style, an imaginary place, or a map that opens onto rich content, start from a custom plan (an image).
To try it, create a free account and import your plan.